What is Data Blending in Tableau?
Data visualization is important in order to make effective business decisions. Advanced visualization of data can lead to better results, cost cutting, and more productivity through data-backed action based on generated insights. Data blending is one such technique that is highly valuable to add more dimensions to the data by involving other sets of data. Notably, data blending can be defined as a process of combining data from various sources to get secondary insights. This allows companies to acquire additional information through data sources other than the primary one.
Further, data blending allows data to be blended and displayed together to add more perspectives or dimensions to this data. To effectively use Tableau and implement techniques such as data blending, Tableau eLearning courses are highly recommended. Let’s learn what Tableau is and how to blend data in this extensively used business intelligence or data visualization tool.
What is Tableau?
Tableau is an interactive data visualization software or tool that helps in analytics, reporting, and business intelligence and for effectively using databases to forecast or gain insights. It is being extensively used for business analytics, performance analysis, financial analysis, data analytics, and other fields related to data science.
Tableau started as a tool for exploring or analyzing data cubes or relational databases. However, it has slowly secured its place as one of the most popular tools for data scientists and analysts. And, it is definitely one of the best. It is still a data visualization tool, but it is also so much more. Tableau allows businesses to make actionable business decisions.
Moreover, Tableau is easy to learn and simple to use, as well as can generate rapid visualizations from data sources. It has enormous support from the American company, Tableau Software, behind it, receiving regular updates and upgrades. Tableau also has massive support for various data or file formats, spreadsheets, relational databases, cloud databases, and extensions. It was built much earlier in this century but unlike older data visualization tools or legacy software, it has kept upgrading and optimizing itself. Tableau fits right into modern times and fulfills the various business requirements that are dependent on data and analytics. Sectors such as marketing, finance, and healthcare, all are supported by data-backed insights that can be generated by Tableau from data sources.
Besides, Tableau generates graph-like visualizations such as treemaps, charts, histograms, and waterfall charts. It is interactive and displays information in these charts in a hierarchical order using size and colors. Tableau can effectively use processing cubes, cloud sources, and relational databases for the extraction, storage, and retrieval of data that can be added and used alongside the data engine. The tool is fast and allows the exploration and management of data with ease, also allowing actionable insights to be shared with ease. It is the leading data visualization tool in the market with over 150,000 users worldwide.
What is Data Blending in Tableau?
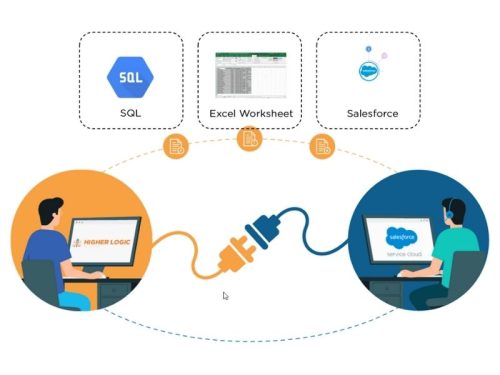
As discussed earlier, data blending in Tableau is fundamentally the process of implementing multi-dimensional visualizations inside a single view through combining various data sources. When data blending is used, queries are sent to databases for every imported data source and the results are generated by Tableau as a graph-like presentation.
Data blending is one of the most powerful features of Tableau as it is extensively used in the case of data that is related to each other. There are many instances where data needs to be combined together in order to find particular statistics or conduct deeper analytics. For instance, if data has multiple variables, dimensions, and factors involved with it, Tableau can help blend it all together to get the required metrics or to divide and categorize the information based on data from all the sources that have been blended.
Tableau builds advanced conclusions based on the other data sources as well which allows companies to better isolate or identify determining factors that influence the target data. During blends, the two sources of data are referred to as primary and secondary sources of data. The graphs and visualization are completely based on how the data is interrelated and the relationship between factors that are assumed as X and Y axis. Tableau can also generate visualizations of even higher dimensions that are more complex in nature.
Generally, relationships and joins are enough to involve data with different levels of details and structural classes. However, these methods are limited and also restricted when working with more than one data source. Blends are perfect for scenarios where data is not truly combined but instead are blended in an independent manner. The data is curated together in a singular view, but they are independent of each other while complimenting each other at the same time. Due to this reason, data blending can handle multiple different levels of information, unlike joins and relationships.
Data blending allows complex blends of data that can be established individually on each sheet but never need to be fixed. Joins on the other hand initiate the complete mix of data and are based on a decided set of information. In comparison, blends are just the generated results that are simply blended together and can be altered at any point in time.
Data blending is truly useful for linking fields, establishing data on independent sheets, and combining data sources that are published or unpublished. Data blending is easy to learn and can be performed by integrating a field from another data source in the primary view. Data blending is run using a sheet-by-sheet approach that requires connecting data sources by using fields on each sheet, classifying through rows and columns, or dragging and dropping target sets of data into the sheet.
By and large, Tableau is perfect for students, teachers, professionals, businessmen, data scientists, and analysts everywhere. It is understandably the most flexible and powerful end-to-end data management and analytics tool out there that is also highly secured. Tableau also has a huge community behind it and thousands of companies use this versatile analytics software, thus making it really handy to learn how to use Tableau effectively.


Add comment