


America’s Best Universities Rankings 2026-27
The inaugural EW-Launchpad Rankings 2025 demonstrated that popular league tables ranking America’s best universities were misleading for households searching best undergraduate education. To compile this year’s league table, the Launchpad Steering Committee undertook a rigorous review of previous methodology, drawing upon a full year of data analysis and feedback
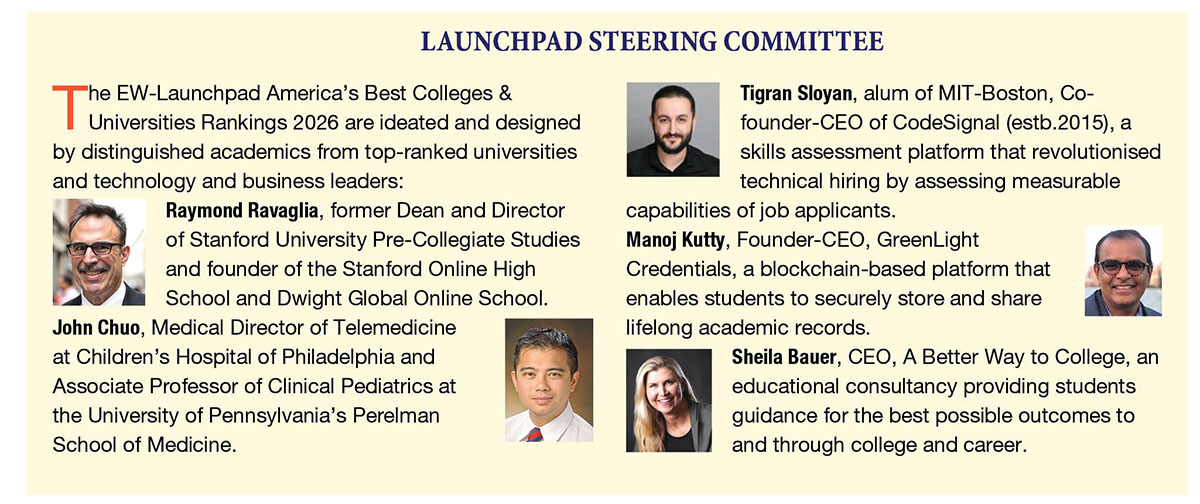
Last April (2025), in collaboration with the Michigan (USA)-based Launchpad Rankings LLC, a US-based education research company supported by eminent educators and a distinguished steering committee (see box, p.113), EducationWorld published an unprecedented league table of America’s best universities/colleges (in the US they are synonymous). This “reverse ranking” initiative, which focused on school-leavers struggling to short-list America’s best undergraduate education institutions, evoked great enthusiasm and encomiums.
This year again, to provide Indian school-leavers aspiring for American undergrad education, the best options, we present revised EW-Launchpad Rankings 2026, a valuable gift given that last year India surpassed China to become America’s top source country for international students, with 3.6 lakh ambitious youth enrolling in US institutions for higher education.
The inaugural 2025 rankings demonstrated that conventional wisdom about American higher education — shaped by publications like QS, Times Higher Education, US News & World Report, and Forbes — is insufficient, indeed misleading, for Indian households searching for the best undergraduate education for their children. To compile this year’s league table, the Launchpad Steering Committee undertook a rigorous review of the methodology, drawing upon a full year of data analysis and feedback.
The outcome is a refined league table that identifies institutions providing excellent undergrad education by ensuring close alignment between rankings and publicly available data. The second EW-Launchpad Rankings 2026 presents updated rankings for 767 of America’s well-reputed colleges and universities for undergrad education.
Institutional assessment methodology
The traditional methodology of ranking universities — employed by QS, Times Higher Education, US News & World Report, and others — is to accord heavy weightage to metrics such as research output, faculty citations in academic journals, peer reputation surveys, employer opinion polls, endowment size, and admissions selectivity. While these are appropriate parameters for assessing global standing of postgrad institutions, for households investing in undergrad education — often the single largest investment in their children’s future — these parameters measure institutional prestige, not undergrad education quality.
Consider faculty citations. A professor who publishes groundbreaking papers in refereed journals is undoubtedly an accomplished scholar. But a prolific researcher is not necessarily a dedicated teacher of undergraduates. In many cases, the most heavily cited faculty at elite research universities spend most of their time in laboratories, supervising doctoral candidates, and attending conferences — not teaching introductory courses to first-year students. A university’s citation count doesn’t enlighten parents about whether their child will be taught by a professor or by a graduate teaching assistant.
Likewise, peer reputation surveys — under which university administrators and academics rate other institutions, tend to reward name recognition and historical prestige rather than current teaching quality. A university that has been established for a century will be awarded high scores in reputation surveys regardless of neglect of its undergraduate programmes. A similar bias is inherent in employers’ surveys: recruitment managers in large corporations are likely to favour graduates from well-known names without any direct knowledge of how those institutions actually educate their students.
The fundamental weakness of opinions-based institutional surveys is that they are not independently verifiable. When institutional rankings depend on responses to a questionnaire — whether sent to academics, employers, or students — the results cannot be audited or reproduced by a third party. Response rates are often low, and the respondents themselves may have limited knowledge of the institutions they are invited to evaluate. The outcome is a survey that reflects perceptions rather than reality, and universities are incentivised to invest in marketing and brand management rather than in quality teaching.
In designing the EW-Launchpad Rankings we have adapted a fundamentally different methodology. Every data point used to evaluate institutions is drawn from publicly available, government-maintained, or institutionally reported datasets. There are no opinion surveys, no employer questionnaires, no peer reputation scores, or any subjective assessment. The EW-Launchpad league tables are built entirely on verifiable facts of America’s best universities for undergrad education — how they teach, the opportunities they provide, and learning attainments of their graduates.
Publicly available data
Our commitment to publicly available data is not merely a methodological preference — it is a core principle. Rankings that depend on proprietary surveys or confidential data cannot be scrutinised or challenged. In traditional rankings, if a parent questions why a particular university received a low score, the evaluating organisation can point to its survey methodology but cannot share the underlying responses. The family is asked to trust the process without being able to verify it.
The EW-Launchpad Rankings are different. The three primary data sources — Integrated Postsecondary Education Data System (IPEDS), College Scorecard, and Common Data Set — are all accessible by the public.
IPEDS is maintained by the US Department of Education’s National Center for Education Statistics and is based on mandatory reports of all institutions that receive federal financial aid. The College Scorecard, also maintained by the Department of Education, draws on IPEDS and additional federal data including tax records to provide information about students post-graduation earnings and debt. The Common Data Set is a standardised reporting framework voluntarily adopted by the vast majority of American colleges and universities, providing detailed information on class size, faculty composition, and other operational details.
Because these data sources are public, any interested party — parent, guidance counsellor, journalist, or universities themselves — can examine the raw data and verify how a particular score is derived. Such transparency is essential for building trust in institutional rankings. It also ensures accountability: if a data point is anomalous, it can be identified and corrected. Launchpad Rankings LLC’s Steering Committee actively reviews and validates data, and has on occasion corrected scores when institutional self-reporting was found to be inconsistent with other sources.
Kettering University: 100 percent career-track placements
Undergraduate education focus
The five parameters of undergrad education excellence of the EW-Launchpad Rankings were chosen because they directly address issues that matter most to households investing in undergrad higher education. Every institutional assessment parameter reflects an aspect of the student experience that is measurable and consequential.
Teaching Focus poses the question whether the university is genuinely focused on teaching undergraduates. Are classes taught by committed, full-time faculty members, or by adjuncts and graduate assistants? Is the institution prioritising teaching, or is teaching secondary to citations and research?
Class Size examines whether students will learn in an environment conducive to meaningful engagement with faculty. Small classes enable the mentorship, personalised teaching, and intellectual relationships that define high-quality undergraduate education institutions — that produce the letters of recommendation, professional connections, and personal growth that serves graduates throughout their careers.
The Experiential Learning parameter evaluates whether ranked universities/colleges provide structured opportunities for students to apply learning in real-world settings through internships, co-ops, and professional placement. For international students in particular, this should be the decisive factor — without institutional support for experiential learning, they may graduate with theoretical knowledge but no practical experience or professional network in American industry.
Economic Mobility measures whether a university actually delivers the promise of upward mobility. Do graduates earn more than they would have without their degree? Does the college/university serve students from lower-income backgrounds and help them achieve financial success?
Retention Rate provides a straightforward check on student satisfaction. If students don’t return for second year learning, something is wrong, regardless of what any reputation survey might suggest.
What EW-Launchpad Rankings deliberately exclude
The choice of institutional measurement metrics to exclude is as important as the choice of parameters included. EW-Launchpad Rankings deliberately exclude several metrics that feature prominently in other ranking systems:
Research output and faculty citations are excluded because they measure the university’s contribution to academic scholarship, not the quality of undergraduate teaching. A university can be a world leader in research while providing mediocre undergraduate education, and vice versa.
Peer reputation and employer surveys are excluded because they are subjective, unverifiable, and heavily influenced by historical prestige and brand recognition. They reward fame rather than quality.
Admissions selectivity — acceptance rates, average test scores, and yield rates — is excluded because it measures the quality of incoming students, not the quality of education they receive. A university that rejects 95 percent of applicants has demonstrated that it is popular, not that it teaches well.
Endowment size and financial resources are excluded because wealth is a measure of institutional power, not educational effectiveness. Some of the best undergraduate teaching in America happens in modestly endowed institutions that have chosen to invest resources in faculty, small classes, and experiential programmes rather than in research infrastructure and real estate.
By focusing exclusively on undergraduate education and publicly verifiable data, the EW-Launchpad Rankings provide households with a rankings league table that rewards substance over image. They answer a simple question: if you send your child to a university included in this league table, what type of education will they actually receive?
 EW-Launchpad Ranking 2025 vs. 2026: What’s changed?
The five core parameters remain unchanged from 2025: Economic Mobility, Experiential Learning, Teaching Focus, Class Size, and Retention Rate. However, the 2026 methodology draws upon more granular data to introduce three refinements that strengthen the model’s capability to differentiate between colleges/universities.
Experiential learning given greater importance. Weightage awarded to experiential learning has been raised from 20 to 25 percent of the total score and restructured into three components — Program structure that evaluates how deeply internships, co-ops, and practical learning are embedded into the curriculum; Field intensity that measures likelihood that a student will earn a degree in a career-oriented field, acknowledging that universities with robust programmes in engineering, health professions, computer science, and business tend to provide more structured pathways from classroom to career; Employment outcomes captures post-graduation employment rates. This restructuring significantly improves the model’s capability to distinguish between institutions on a dimension that is critical to international students in particular.
Retention weightage reduced. The weightage of this parameter has been reduced from 10 to 5 points. Analysis of the 2025 rankings indicated that retention scores are higher in well-reputed institutions, with most scoring 80 percent or higher. While the total has been reduced, the distribution has increased, with universities rewarded more for even slight differences under this metric.
Enhanced precision for Teaching Focus. Although Teaching Focus retains its 25-point weight of last year, assessment under this parameter/metric has been refined to produce finer-grained differentiation, with greater sensitivity to faculty mix, and fairer treatment of institutions that do not use the traditional tenure system. Why cluster rankings?
As in 2025, this year also the Launchpad Steering Committee opted for cluster rankings format rather than strict numerical order. The 767 colleges and universities are grouped into Diamond, Platinum, Gold, Silver, Bronze, and Honourable Mention categories. While numerical scores offer precision, the Steering Committee was unanimous that cluster rankings make comparisons simpler and allow for other parameters such as preferred location, family association, and preferred programmes availability. Numerical scores suggest overly precise distinctions between institutions and signal levels of precision rarely justified by data quality. Cluster rankings also expand the range of parents’/students’ choice, concluded the Steering Committee unanimously.
Explaining year-on-year change
Because the 2026 rankings methodology introduces structural changes, some institutions are ranked in different clusters this year. Approximately 40 percent of institutions remain in the same cluster as in 2025 with 32 percent of universities/colleges moving up and 28 percent down. These changes reflect improved capability of the refined methodology to identify teaching-focused, career-preparatory institutions.
Parents/students should note that differential cluster rankings do not necessarily indicate a change in an institution’s quality of education, they reflect a more nuanced measurement of institutional assessment parameters that matter most in undergraduate education.
Looking ahead
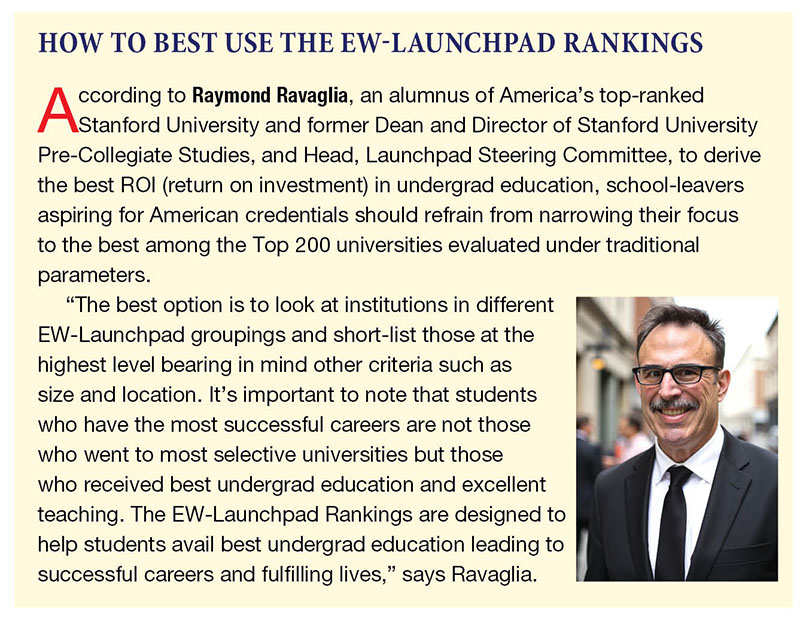
The EW-Launchpad Rankings are a living project. The Steering Committee continues to explore refinements to better capture the best undergraduate student experience, guided by the principle that rankings should be built on publicly available data, verifiable information, and factors that directly determine the quality of undergrad education provided to students. Future editions may incorporate additional public data sources as and when they become available.
For school-leavers, the decision of choosing the most suitable undergrad college/university requires balancing emotional desire with practical considerations. By evaluating universities under the parameters of teaching focus, class size, experiential education opportunities, retention record, and post-graduation economic mobility — and by grounding every score in publicly available, verifiable data — the EW-Launchpad America’s Best Colleges & Universities Rankings 2026 identify 767 institutions providing best quality undergraduate education in the United States.
“Most rigorous co-operative program countrywide”
 In the EW-Launchpad America’s Best Undergrad Education Universities Rankings 2026, Kettering University, Flint (Michigan) is ranked in the highest Diamond tier with highest score. Summiya Yasmeen interviewed Dr. Robert K. McMahan, President of Kettering University. Excerpts:
What is your reaction to Kettering University being ranked America’s #1 university for the second consecutive year in the EW-Launchpad America’s Best Undergrad Education Universities Rankings 2026?
The ranking confirms what the data have been saying for years. Kettering students graduate with nearly 100 percent industry placement, typically in career-track positions, within months of commencement. This doesn’t happen by accident. It happens because every dimension of this university is organised around a single objective: producing graduates prepared to contribute from day one. The calendar, the curriculum, employer relationships all serve that objective. Launchpad has built a methodology that measures exactly those outcomes. When you measure what matters to undergrad students and their families as well as the employers who hire them, institutions structured to deliver these results will rise to prominence. That is what happened here, and it is what happened to many other outstanding schools in these rankings that traditional league tables overlook.
To what major factors do you attribute Kettering’s #1 ranking?
Start with structure. Kettering operates the most rigorous cooperative (workplace) education program in the country. Every student alternates between classroom and workplace in 11 terms over five years. Not a self-selected subset, every one. That is not an internship bolted onto a conventional degree program. It is the organising logic of Kettering University.
This structure produces results the data capture. The New York Times ranks Kettering #1 in economic mobility among highly selective private colleges. The Economist ranks us #4 nationally in patents awarded to our graduates. The Wall Street Journal places us in the Top 10 for career preparation. Payscale.com reports our graduates’ median starting salary at over $75,000, perhaps the highest countrywide.
Moreover consider the downstream evidence: Kettering alumni have risen to become CEOs of General Motors, Valvoline, Reuters, BorgWarner, Merrill Lynch, PHINIA, and other Fortune 500 companies. More than 1,500 alumni have served in C-suite roles at major corporations. No university our size produces numbers like these.
Kettering is ranked #1 on the parameter of Experiential Learning. Please comment.
Most universities that claim experiential learning focus offer something closer to exposure. A summer internship; a co-op term or two or semester-long project. Those experiences are valuable, but they fall below what I call the threshold of effectiveness: the point at which a student moves from token familiarity with a profession to genuine mastery of it.
Kettering crosses that threshold. Our graduates leave with two and a half years of substantive, mentored work in a field of their choice, earning as much as $100,000 over the duration of the program. Many have been promoted before they receive their degree. That doesn’t happen when the experience is peripheral to the degree. It happens when the institution commits to structuring everything around making the work consequential to the student and the company. The academic calendar, the curriculum, the depth of employer partnerships all bend toward that purpose.
We partner with over 600 employers at a level of integration that most universities haven’t attempted. That commitment is the second threshold: institutional willingness to reorganise itself around the student’s professional development rather than asking employers to fit into the academic calendar as it has always existed.
How would you assess the EW-Launchpad Rankings methodology versus other ranking systems and its distinct parameters that evaluate the undergraduate education experience?
Launchpad asks a question that most ranking systems do not: what do the data say about which institutions actually produce successful graduates? That reframe matters. Traditional rankings are largely reputational. Administrators vote based on name recognition. A dean in Arizona may have no firsthand knowledge of a small engineering university in Michigan, but putting Harvard and Princeton at the top is always a safe bet. Colleges/universities without football teams and low media profiles don’t receive votes regardless of what their graduates achieve.
Launchpad replaced opinion with sources that are public and auditable: IPEDS, the College Scorecard, Common Data Set. This methodology organises that data around parameters that predict student success: teaching focus, class size, experiential learning, retention, and economic mobility. That is a genuine service to undergrad students and parents. It has highlighted institutions that deliver outstanding undergrad education outcomes but have been invisible in traditional rankings, giving prospective students more options and, in many cases, more affordable and accessible ones. The proof is in the alumni. Many of the most successful leaders in American business come from schools that reputational rankings ignore. Launchpad’s methodology corrects that void.


Add comment